Advance monitoring and performance tuning in Java

Java advance monitoring and performance tuning settings to be applied in Java Application Server startup files. Works for both Tomcat and Wildfly.
1. Java OPTS for JMX
Java Management Extensions (JMX) is a Java technology that supplies tools for managing and monitoring applications, system objects etc. Those resources are represented by objects called MBeans (also called Managed Bean).
1
2
3
4
5
6
-Dcom.sun.management.jmxremote
-Dcom.sun.management.jmxremote.port=6000
-Dcom.sun.management.jmxremote.authenticate=false
-Dcom.sun.management.jmxremote.ssl=false
-Dcom.sun.management.jmxremote.rmi.port=6001
-Djava.rmi.server.hostname=192.168.1.1
Once the settings are in place, we can use JConsole tool to monitor the server.

Overview Tab to get metrics like Heap, Running Threads and Classes loaded

Link to Original Article Oracle Java 7 Docs
2. Java OPTS for GC Log
Garbage Collection GC tuning is the process of adjusting the startup parameters of your JVM-based application to match the desired results. It’s crucial for the garbage collector to work as efficiently as possible. The GC process can be heavy. Settings for capturing Garbage collection logs is mentioned below.
1
-verbose:gc -Xloggc:/home/centos/gc.log.'date +%Y%m%d%H%M%S' -XX:+PrintGCDetails -XX:+PrintGCDateStamps -XX:+PrintGCApplicationStoppedTime
Once the log is captured, we can use GCEasy.io to analyse the output.
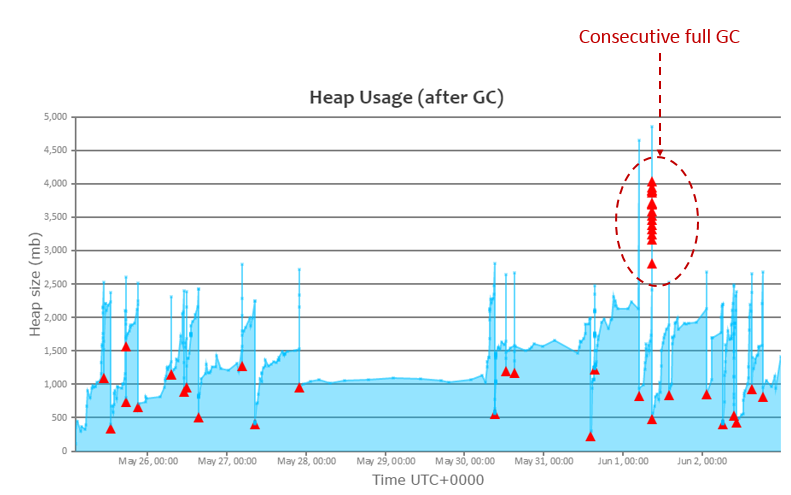
Link to Original Article GCEasy.io
3. Java OPTS for Heap Dump
Modern applications waste memory because of several reasons: Duplicate String, Duplicate Objects, Inefficient Collections etc. Heap dump can be used to detects those inefficiencies.
1
-d64 -server -XX:+HeapDumpOnOutOfMemoryError -XX:HeapDumpPath=/tmp/heap -Djava.util.Arrays.useLegacyMergeSort=true
Once the log is captured, we can use Heaphero.io to analyse the output.
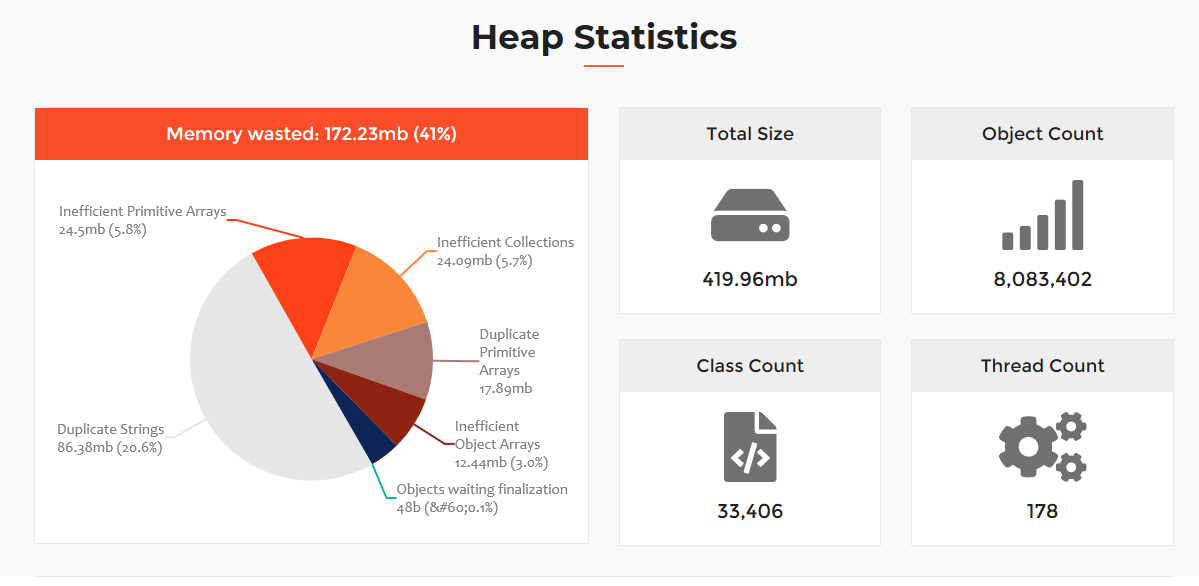

Link to Original Article Heaphero.io
4. Thread dump
A thread dump is a snapshot of the state of all the threads of a Java process. The state of each thread is presented with a stack trace, showing the content of a thread’s stack. A thread dump is useful for diagnosing problems as it displays the thread’s activity. Thread dumps are written in plain text, so we can save their contents to a file and look at them later in a text editor.
Thread dump using jstack
1
jstack <java-process-id> > /tmp/threaddump.txt
Once the thread dump is captured in a file, we can use FastThread.io to analyse the output.


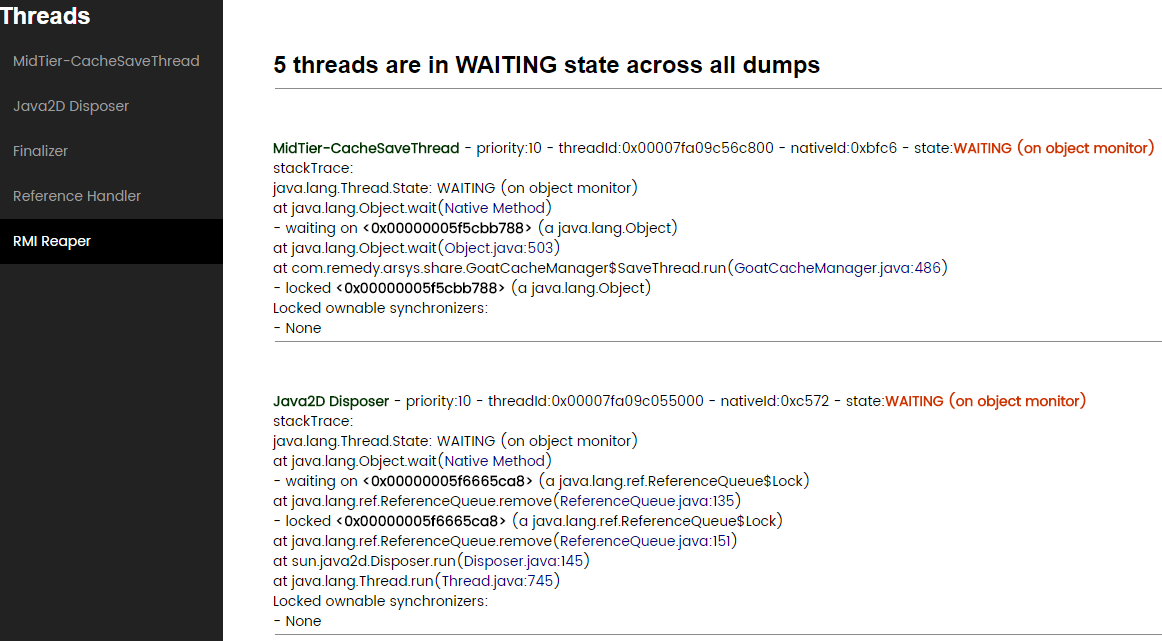
Link to Original Article FastThread.io